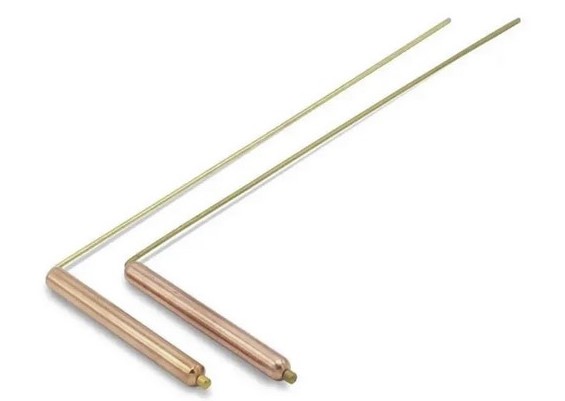
Forks or L antennas
Dowry plants, also known as L antennas, play a key role in dowsing. These specific antennas are used to detect energy fields and radiation. Their sensitivity makes it possible to find different energy flows.
Dowsing antennas are used in a variety of fields, including geotherapy, water source detection, and radiation research. Their application ranges from energy testing of space to finding underground resources. The ability of sensitive reception makes them an important tool in the practice of dowsing research.
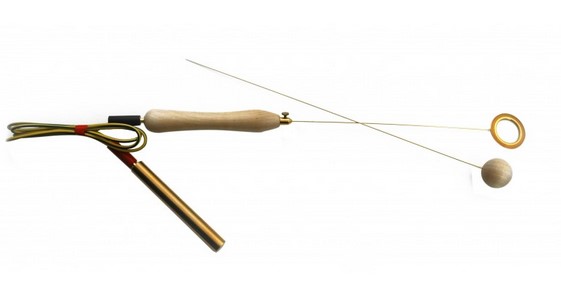
Biotensor
The dowsing bio-tensor is a sophisticated device used in dowsing to detect subtle energy changes in the environment. This tool often takes the form of a small device with a moving part, often made of metal.
The dowsing bio-tensor reacts to energy flows or vibrations in the user's environment. Dowsers use this tool to ask questions, seek information, or determine the presence of energy fields. The sensitivity of the bio-tensor allows users to detect and interpret different energy frequencies.
This simple but powerful tool is often used in alternative practices and dowsing, providing an additional level of perception and understanding of the energetic aspects of the environment. It is important to note that the use of dowsing tools requires practice and sensitivity in order to achieve the best results.
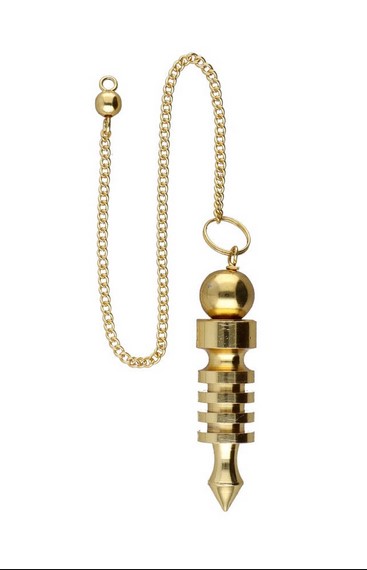
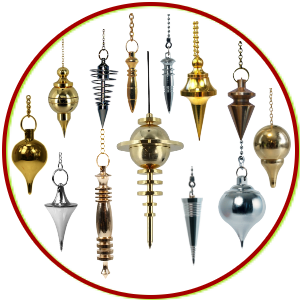
Visak
The dowsing pendulum is a simple but effective tool in the practice of dowsing. This instrument consists of a heavy mass, often on a chain or string, that responds to subtle energy changes.
To use a dowsing pendulum, dowsers ask questions or explore energy fields by holding the pendulum over a specific object or space. Deviation in oscillations or rotations of the pendulum is interpreted as an answer to the questions asked or the presence of specific energy frequencies.
The dowsing pendulum is used for a variety of purposes, including searching for water, making diagnoses, or exploring the environment. The skill of the user and sensitivity to work from a plumb line are key to accurately interpreting oscillations and achieving optimal results in dowsing.
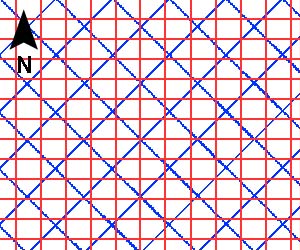
Map with Hartmann and Carey lines
The map with Hartmann and Curry lines is a dowsing tool that identifies specific energy lines on Earth. These lines are part of dowsing research that studies the impact of underground energies on the environment.
Hartman lines are considered energy directions that often follow the orientation of geographic points. Curry lines are similar, but they intertwine at a certain angle.
Dowsers use a map with Hartmann and Curry lines to identify the potential effects of these energy grids on health, sleep or general well-being. This tool enables precise monitoring and study of energy flows in a certain space for a better understanding of the impact of the environment on people.
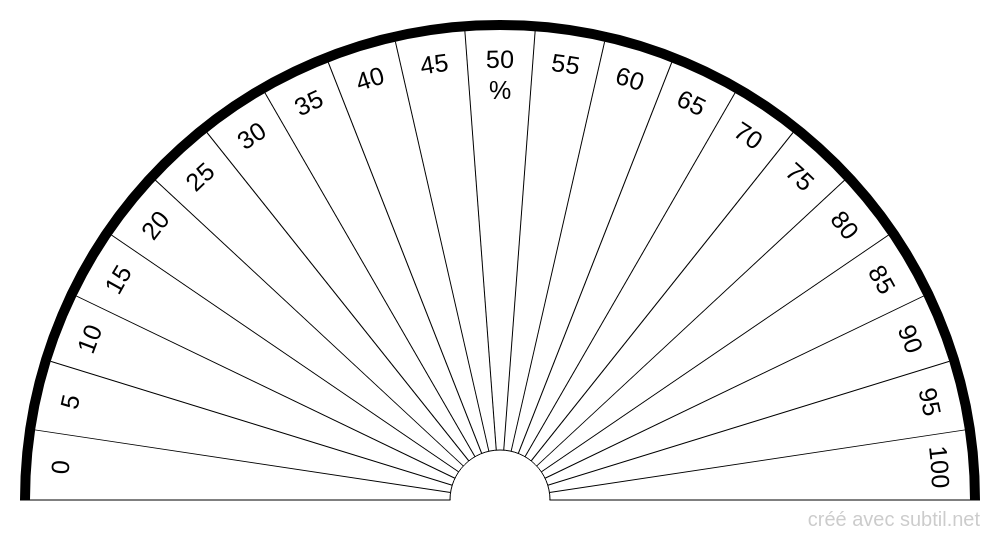
Dowry charts and graphs
A dowsing chart is a chart with a series of symbols used in dowsing to ask questions or get information about certain energetic aspects. This tool may contain different symbols, numbers or colors and is used with a dowsing compass or other dowsing tools.
When the dowser asks a question, the plumb line above the tablet shows oscillations or vibrations over certain symbols. By interpreting these oscillations, the dowser can get answers to questions or information about specific energy aspects of a space or object.
The dowsing chart is a practical guide to help users focus their dowsing efforts and obtain more accurate information. Combining the skill of dowsing with proper chart use can provide useful insights into subtle energetic changes in the environment.
A dowsing chart for measuring energy is an instrument in dowsing that helps in numerically measuring and interpreting energy frequencies in the environment. This chart may contain numbers, symbols, or colors that dowsers use to obtain quantitative information about the energetic aspects of a space or object.
When the user asks a question or focuses his intention, the dowsing manifests itself through the oscillations of the dowsing plumb line above certain parts of the chart. Numerical values or symbols on the graph help to accurately determine the intensity or type of energy frequency being measured.
The dowsing energy chart allows users to quantify and better understand the various energy flows in the environment. With the combination of skill and this tool, dowsers can gain deeper insights into the subtle aspects of the energy in the space they are studying.